Back to blog
Tableau Data Visualization & Use of Web Scraping: Tutorial


Tableau Scraping Python Library: Importance of Big Data
In the world of business, big data is the most important thing to make proper and effective business decisions. Today almost every business, even a small start-up generates data. If a company has a website, a presence on social media, and accepts electronic payments, it can generate data about its customers. When you need to represent this data in a graphical format to communicate it clearly and efficiently, data visualization comes into play. In this article, we will talk about Tableau data visualization, and how it can help users in data visualization.
Exploring Python Tableau Scraping Library
Tableau is a powerful tool for data visualization that can be used for modern business intelligence. Thanks to Tableau visualization feature you can extract data from the web sources and give it a visual format to make it more understandable. The tool also enables real-time scraping and cloud support. If you’d rather have this handled end-to-end than build and maintain it yourself, take a look at our data visualisation solutions — we turn scraped data into live dashboards without the DIY setup.
Web scraping Tableau products
Tableau currently offers 5 main options, each covering a different deployment need:
- Tableau Desktop is the core authoring tool for building dashboards and visualizations locally. It connects to files, databases, and the REST API Connector for web-sourced data. Available as a free edition for local use or as part of a paid Creator license starting at $75/user/month.
- Tableau Public is a free version for creating and publishing visualizations publicly. All dashboards are visible to anyone — not suitable for business or proprietary scraped data, but useful for educational projects and public datasets.
- Tableau Cloud (formerly Tableau Online) is the fully hosted version. Dashboards are hosted in the cloud, extract refreshes on schedule, plus the deployment scales without internal IT overhead. Available with Creator, Explorer, and Viewer license tiers.
- Tableau Server is the self-hosted option for organizations that need full control over data storage, security, and governance. Same license structure as Tableau Cloud, but the infrastructure runs on your own hardware or private cloud.
- Tableau Next is Tableau’s newest tier, built around agentic analytics and AI-powered workflows. Sold separate or bundled with Tableau Cloud in the Tableau+ package. Suited for teams that need AI-assisted data prep and conversational analytics in addition to their existing dashboards.
For web scraping Tableau dashboard workflows, Tableau Cloud and Tableau Desktop are the most common entry points — Cloud for team-wide sharing, Desktop for building and testing the visualization before publishing.
Tableau Data Visualization Use Cases for Web Scraping Projects
How to Visualize Data with Tableau Desktop
Once you get Tableau Software, you can connect your data file and create an interactive data visualization. Let’s consider Tableau Desktop for creating data visualization for your data saved in a CSV file.
- Run Tableau Desktop.
- From the Start page, select the connector type (how to connect to your data).
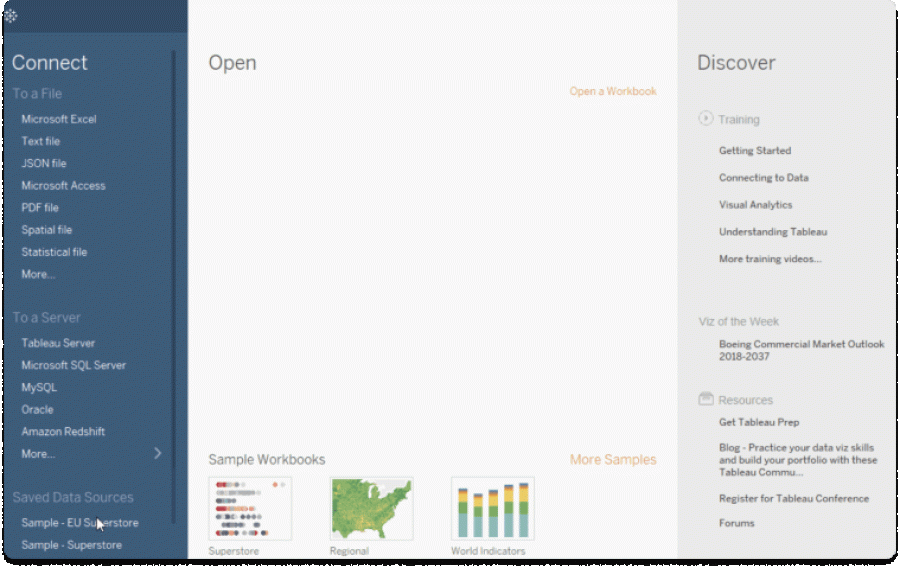
2. From the Start page, select the connector type (how to connect to your data).
3. Click on the Text file option to select Tableau import CSV data file.
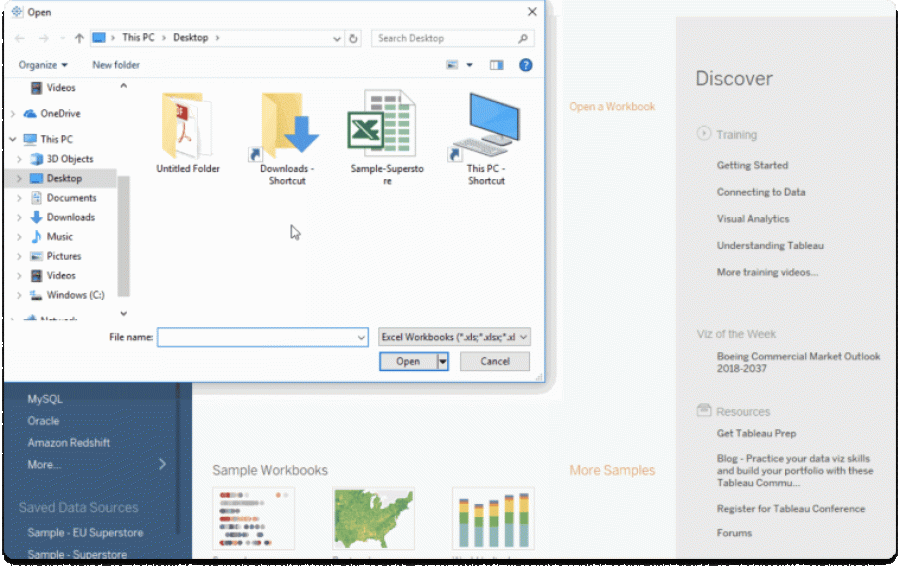
4. Once you select the file, your data will be imported, and you can use it to visualize.
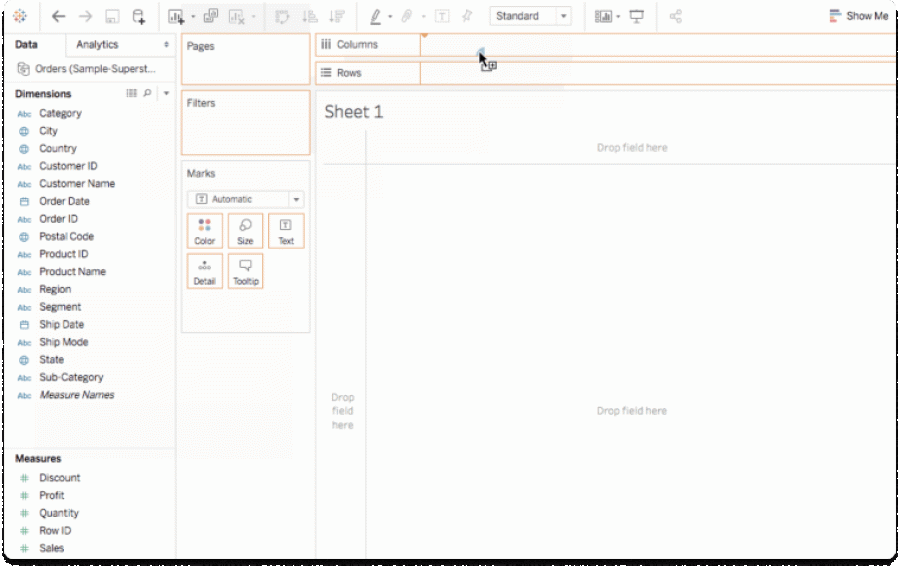
Tableau REST API Connector: The Current Standard for Web Data
The replacement of the Web Data Connector is REST API Connector, built and maintained by Tableau and available on Tableau Exchange. This shift matters for anyone doing Tableau web scraping workflows. The mission of REST API Connector is to handle the connection between web data sources and Tableau dashboards today. It runs as a packaged .taco connector, installs directly into Tableau Desktop, and handles the connection through a JDBC driver Tableau supports natively.
What the REST API Connector Actually Does
The connector fetches data from any REST API endpoint over HTTP GET and returns it in a format Tableau reads directly. It supports JSON and CSV response formats, which covers the output of virtually any Python Tableau scraping library or custom scraping pipeline that delivers structured data. For authentication, it handles Basic, Bearer token, and OAuth via authorization code flow — so it works with both public endpoints and secured data sources.
However, it does not replace the scraping layer; the connector reads from an API endpoint — if your data comes from scraped web sources rather than an API, the pipeline still runs through an external script. The standard web scraping Tableau workflow looks like this:
Python scraper collects data from the target source —> exposes that data via a lightweight local endpoint or saves it to a structured file —> the REST API Connector pulls from there into Tableau on any refresh interval.
How to Set It Up
The setup requires three steps.
1.Download the JDBC REST API driver from Tableau’s driver page and place the .jar file in the correct directory for your OS:
- Windows: C:\\Program Files\\Tableau\\Drivers
- macOS: /Users/[user]/Library/Tableau/Drivers
- Linux: /opt/tableau/tableau_driver/jdbc
2.Install the REST API Connector from Tableau Exchange. The connector works with Tableau 2023.3 and later — earlier versions are not supported.
3.Launch Tableau Desktop, go to Connect → To a Server, select REST API, and configure your endpoint URL, authentication method, and response format. For JSON responses, JSONPath configuration tells the connector where the records array sits in the response structure. For CSV, you set the delimiter.
Note: The connector is extract-only. Live queries against the API are not supported — data gets extracted into Tableau first, then the dashboard works from that extract. For Tableau data visualization use cases built on scraped data that updates on a schedule, this is generally acceptable. DataOx structures scraping pipelines with delivery intervals that align with Tableau’s extract refresh cycles, so the dashboard always reflects the latest collected data without manual intervention.
When to Use Python Instead | DataOx’s Expert Approach
The REST API Connector covers the connection layer cleanly, but the Tableau web scraping dashboard workflow is not a universal approach. For sources that require browser automation, CAPTCHA handling, session management, or transformation before the data is usable, you might need a Python pipeline.
DataOx builds the scraping infrastructure that collects and structures the data & the delivery format that plugs directly into Tableau’s REST API Connector without additional reformatting on the client’s end. Once you decide to visualize your scraped data, refer to DataOx’s professionals who are always happy to help you with professional advice and service. Schedule a free consultation with our expert and find out how web scraping and data visualization can help you boost your business.

web scraping services
Get free consultation
FAQ about Tableau web scraping
Can Tableau pull data from websites directly?
Tableau does not scrape websites on its own. It visualizes data that has already been collected and structured. The REST API Connector handles the ingestion part (fetching JSON or CSV from an endpoint) but the scraping layer that produces that output performs externally. DataOx builds the Python Tableau scraping library pipeline that provides structured data into Tableau, so the dashboard reflects current web-sourced data without requiring manual exports between refresh cycles.
What Python libraries work best for feeding scraped data into Tableau?
The standard stack is requests and BeautifulSoup for static page scraping, Selenium or Playwright for JavaScript-heavy sources, and pandas for structuring the output into a DataFrame before export. The Tableau scraping Python library tableauserverclient handles publishing directly to Tableau Cloud or Server via API. For teams that need the full pipeline — extraction, cleaning, formatting, and scheduled delivery — DataOx builds and maintains it end to end so the data arrives in Tableau without manual handling.
Which Tableau product works best for dashboards built on scraped data?
Tableau Cloud is the most practical option for teams using ongoing scraping pipelines. Scheduled extract refreshes mean the dashboard updates automatically when data updates without the need for manual intervention. Tableau Desktop works for building and testing the visualization locally before publishing. For organizations with strict data residency requirements, Tableau Server gives the same refresh functionality on self-managed infrastructure. DataOx structures scraping delivery to match client’s needs, so the result is always in the right format and on the right schedule.
How frequently can Tableau dashboards update with new scraped data?
That depends on the extract refresh schedule configured in Tableau Cloud or Tableau Server. Daily, hourly, or custom intervals are all configurable through web scraping Tableau dashboard settings. However, pipelines can be an obstacle: how often the source gets scraped and how fast the output reaches Tableau. DataOx aligns scraping delivery interval with the client’s Tableau extract schedule so both sides stay in sync without manual handoffs between cycles.
What format does scraped data need to be in for Tableau data visualization?
Tableau reads CSV, JSON, Excel, and direct database connections without transformation on the Tableau side. For the REST API Connector specifically, the endpoint needs to return JSON or CSV over HTTP GET. For file-based imports, a clean CSV with consistent column headers is enough to start building a web scraping Tableau dashboard. DataOx delivers scraped datasets pre-structured to the client’s requirements — column names, data types, and field order matching whatever Tableau expects on import.
Stay ahead with data insights
Subscribe to DataOx newsletter


get a free consultation
Fill out the form — we'll get back to you with options tailored to your needs.
what happens next
We review your goals and get in touch to clarify scope
Your privacy is a priority — NDA available upon request.
You receive a clear proposal with timeline, budget, and delivery format.
Once approved, we start building your data pipeline.
contact us
Let's find the best solution for your data needs.