Tableau Web Scraping – How to Visualize Big Data with Tableau
Learn about Tableau web scraping and how it can help
in data visualization. Take consultation from DataOx’s
experts for free to know all the details.
Ask us to scrape the website and receive free data sample in XLSX, CSV, JSON or Google Sheet in 3 days
Scraping is the our field of expertise: we completed more than 800 scraping projects (including protected resources)
Table of contents
Estimated reading time: 4 minutes


Introduction
In the world of business, big data is the most important thing to make proper and effective business decisions. Today almost every business, even a small start-up generates data. If a company has a website, a presence on social media, and accepts electronic payments, it can generate data about its customers.

Later on, the information can be scraped and may become a big potential for future business decisions. When you need to represent this data in a graphical format to communicate it clearly and efficiently, data visualization comes into play. In this article, we’ll talk about Tableau, and how it can help users in data visualization.
Exploring Tableau
A Tableau is a powerful tool for data visualization that can be used for modern business intelligence. Thanks to Tableau web scraping feature you can extract data from the web sources and give it a visual format to make it more understandable. The tool also enables real-time scraping and cloud support.
Tableau products
Tableau Software offers 3 main options:
- Tableau Desktop – a data visualization tool transforming the boring tabulated data into attractive graphs that also enable real-time data analytics.
- Tableau Public – a free version that is used to make visualizations in the Tableau Server.
- Tableau Online – a hosted version of Tableau Server where Tableau is available to everyone; your business intelligence will be available on the go and can be shared with others as well.
| Tableau Desktop | Tableau Public | Tableau Online |
|---|---|---|
| Free trial available for 14 days | Absolutely free | Workbooks are created on the Cloud and can be available from anywhere |
How to Visualize Data with Tableau Desktop
Once you get Tableau Software, you can connect your data file and create an interactive data visualization.
Let’s consider Tableau Desktop for creating data visualization for your data saved in a CSV file.
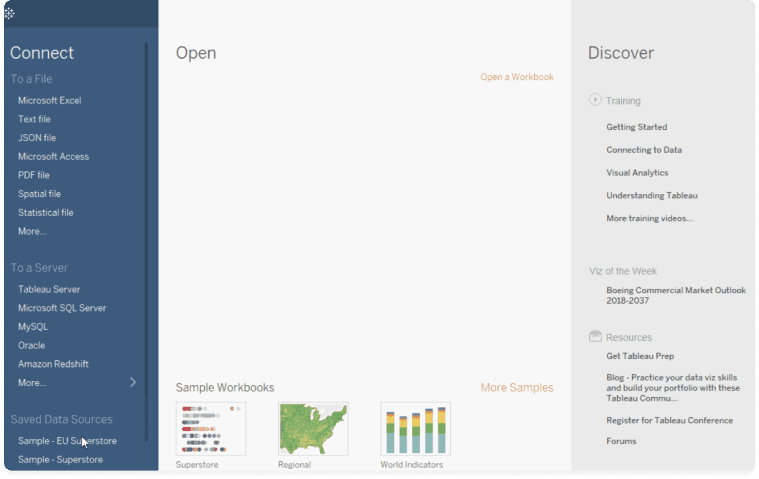
- Run Tableau Desktop.
- From the Start page, select the connector type (how to connect to your data).
-
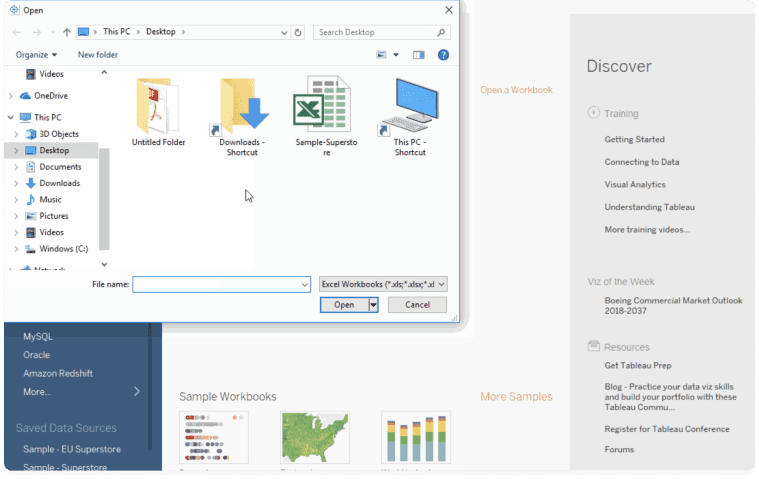
3. Click on the Text file option to select Tableau import CVS data file.
-
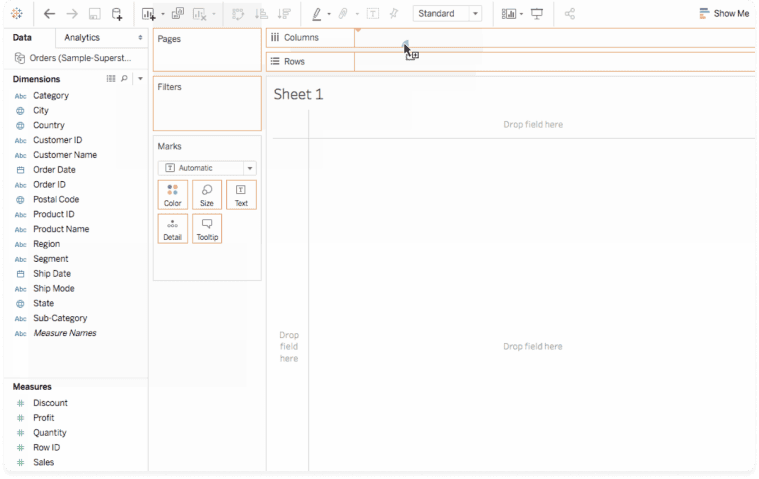
4. Once you select the file, your data will be imported, and you can use it to visualize.
About Tableau Web Data Connector
Tableau Web Data Connector (WDC) enables you to connect to the required web data source accessed via HTTP and use Tableau to scrape, analyze and visualize the data.
Tableau has already created WDCs for different platforms like Tableau Twitter web data connectors. But you can also create your own WDCs, for example, to get data from Instagram periodically and visualize it. All you need is to know how APIs operate and to have some basic skills of a “Google developer”.
How to create Tableau WDC
The WDC principle is simple. The HTML part is what we see, and to connect to web data we use the JavaScript code that reads JSON response and passes data on to Tableau. You can connect to any data from the web services, REST APIs, and JSON data, or any other sources available over HTTP.
For building your own WDC you need:
- Git,
- WDC SDK to build connectors,
- Web server for your WDC.
Once you have all the required staff, follow the instructions on how to build Web Data Connectors or look for the SDK code samples and supporting documentation on the Tableau Community page.
Tableau web scraping FAQ
Tableau is a handy data visualization tool. Thanks to Tableau, you can process large amounts of data and organize them in a convenient format for work and analysis.
How to scrape with Tableau?
There are two ways to process data with Tableau. First, you can upload your collected data file to Tableau Desktop. Secondly, you can connect a data source (website analytics, social media pages, or any other open database) directly to Tableau with WDC (Tableau Web Data Connector). Tableau will process the incoming data and visualize it in a format convenient for you.
How to scrape data from the Tableau dashboard?
Tableau has a REST API service allowing access to different resources on its server. Every service and data type requires separate scripts. Therefore, follow the official documentation and use developer help.
Conclusion
Once you decide to visualize your scraped data, refer to DataOx’s professionals who are always happy to help you with professional advice and service. Schedule a free consultation with our expert and find out how web scraping and data visualization can help you boost your business.
Publishing date: Sun Apr 23 2023
Last update date: Wed Apr 19 2023